
- Thank you received: 0
My pareidolia knows no bounds.
- Larry Burford
-
- Offline
- Platinum Member
-

Less
More
19 years 9 months ago #16228
by Larry Burford
Replied by Larry Burford on topic Reply from Larry Burford
[neilderosa] "By that method, it would probably take millions, billions, or many more scrambles, to come up with a few vague Ss for the subjects to recognize."
Maybe not ...
QUESTION - How many examples of <whatever> must one experience before one should expect chance to provide a match of some sort?
Our intuition about this generally wrong, and usually skewed toward the pessimistic side. Consider the Birthday Paradox, for example,
"How many randomly chosen people must be in a room before the probability that at least two of them will have the same birthday rises to statistical certainty (usually defined as > 95%)?"
Most people give answers near 365, with 366 being very common. The actual answer is (approximately) 42. (Tom: I'm not kidding.)
It only takes 23 to reach a probability of 50% and with 60 people in the same room the probability is above 99%. It does, however, take 367 (not 366) people in the room get the probability up to 100%.
LB
Please Log in or Create an account to join the conversation.
19 years 9 months ago #9206
by rderosa
Replied by rderosa on topic Reply from Richard DeRosa
<blockquote id="quote"><font size="2" face="Verdana, Arial, Helvetica" id="quote">quote:<hr height="1" noshade id="quote"><i>Originally posted by neilderosa</i>
<br />The testers promised that there was no S placed in any of the images, and strictly speaking they are probably correct. But the “psych” program placed varying forms in the 20,000 images, some of which could reasonably be interpreted as vague Ss. <hr height="1" noshade id="quote"></blockquote id="quote"></font id="quote">
As a quick reading of the paper will show, nothing was "placed" in the test patterns. They were 20,000 different "snapshots" of white noise. There was no human or sofware intervention to "add" anything that would look like an S.
Let me give a little analogy, starting with an analog signal and noise, and creating my own test patterns. I'm sure they didn't do it this way, and probably used random number generators to get the 50x50 pixel grayscale values, but this demonstration might impart some reality to it. And the end result would surely be the same.
Start with this image:
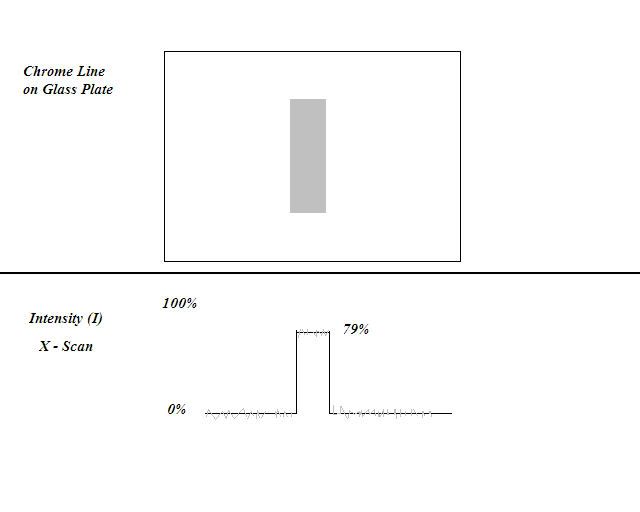
This is a depiction of a chrome line on a glass plate, that is being viewed from above. The measuring device is taking an X scan, through the middle of the plate from left to right, and measuring the Reflectance (or Intensity) of the returned signal. The bottom panel shows the measured return signal with 0% being black, 100% being white, (and everything in between) , with the little gray line being the sum total of all the electronic noise in the system. This signal can easily be digitized to the resultant 0 to 255 grayscale values.
Now, it's easy to see that the chrome line is so reflective that one gets a clear systematic signal that can easily be measure (79%, in this case). So, if we digitized the results, and filtered out the noise (by kernel averaging or whatever), we'd have all 0s for the glass, and all 201s (79% of 255) for the chrome line. We could then do that for each other X line in the plane and come up with an array of numbers(50x50 or whatever number of pixels) that corresponds to the image of the chrome on glass plate. So, in 2 dimensions, it might be all 0s for the glass plate, surrounding the width and height of the line that was all 201s roughly (there might be some small variations, if we couldn't get rid of all the noise.)
But suppose there was no chrome line on the glass plate as in the following image? What then?
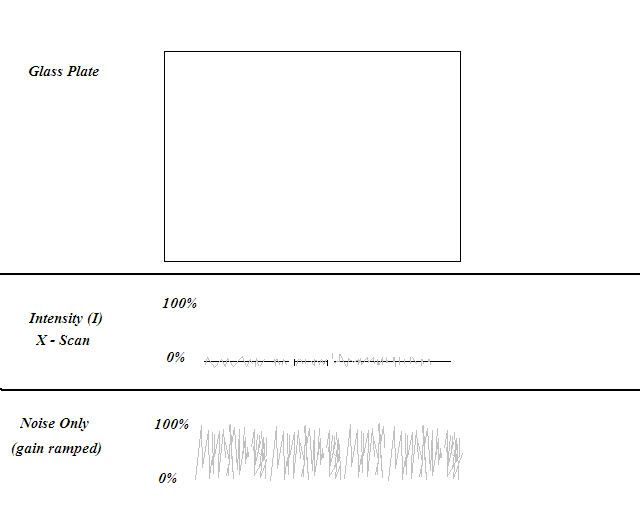
If we did the same center line linescan, with the same gain, and same image filtering, we would come up with all zeroes, and digitized it would be pure black (mostly). See center panel.
But, suppose we were to ramp the gain {the increase (as of voltage or signal intensity) caused by an amplifier; especially : the ratio of output over input}. This would result in the noise being ramped, and since there is no real systematic output signal (since the chrome line isn't there), we would be seeing the linescan for noise only.
Any one who has ever seen this type if thing, knows that the noise output is sort of "alive" in the sense that it's constantly bouncing and shuffling, such that at any given time any point along it, could be up, down or sideways.
Now, suppose we were to take a "snapshot" of the noise signal, print it on graph paper, and blow it up to fill the paper, with the highest level representing 100% (white), the lowest level 0% (black), and interpolate all the middle values to give them a number from 0 to 100, and then digitize, so that for any given snapshot, we have 50 grayscale values for any X line. Then we do it for 49 more X lines from the top of the plate to the bottom, and we get a 50 by 50 grid of random grayscale numbers.
Take another 50x50 snapshot, get different numbers. Repeat that 20,000 times, keep all the arrays, and convert them to images like box "a" for the subjects to view. You can easily see how "putting Ss, or pieces of Ss into the slides", would be totally out of the realm of the study.
(added material) One cautionary note to future readers of this. The above demonstration was more of "thought experiment" than something that might ever be done in actual practice (although it is a real case that's experienced when trying to find faint features on a non-reflective surface). However, it's possible that this type of noise might have some systematic noise in it. For instance, it might tend to be darker on the left than the right, or something like that. On the other hand, the static white noise used in the actual S experiment would not be expected to have any systematic component from the noise itself.
No, what is happening, is exactly what they say is happening:
"Because the subject IS TOLD to EXTRACT the letter S from white noise, the subject attempts to match his/her knowledge of an S with the incoming white noise. To the extent that white noise correlates with all possible patterns, if there is a SMALL but systematic correlation between the knowledge of the subject and the incoming white noise then the subtraction explained above will capture it."
and, "that even under the worst possible condition of information (i.e. absence of it, white noise), people will systematically perceive things."
rd
Please Log in or Create an account to join the conversation.
19 years 9 months ago #17421
by rderosa
Replied by rderosa on topic Reply from Richard DeRosa
One other important point. If there were systematic Ss or parts of Ss placed in the slides by the programmers, the three subjects would have all found the same S. But they didn't. The statistical analysis clearly showed the highest correlations for each subject with a Specific S Font type, and all three were different.
rd
rd
Please Log in or Create an account to join the conversation.
19 years 9 months ago #16229
by rderosa
Replied by rderosa on topic Reply from Richard DeRosa
<blockquote id="quote"><font size="2" face="Verdana, Arial, Helvetica" id="quote">quote:<hr height="1" noshade id="quote"><i>Originally posted by Larry Burford</i>
<br />Maybe not ...
QUESTION - How many examples of <whatever> must one experience before one should expect chance to provide a match of some sort?
Our intuition about this generally wrong,<hr height="1" noshade id="quote"></blockquote id="quote"></font id="quote">
The study of pareidolia leads to a number of interesting side subjects, which are related. One of them is apopenia (the experience of seeing patterns or connections in random or meaningless data.)
en.wikipedia.org/wiki/Apophenia
Another one is the clustering illusion (the natural human tendency to "see patterns where actually none exist." )
en.wikipedia.org/wiki/Clustering_illusion
Quote:
"most people say that the sequence "OXXXOXXXOXXOOOXOOXXOO" (Gilovich, 1993) is non-random, when, in fact, it has many qualities which would also appear to be desirable characteristics of what one expects to see in a "random" stream, such as having an equal number of each result and the fact that the number of adjacent results with the same outcome is equal for both possible outcomes. In sequences like this, people seem to expect to see a greater number of alternations than one would predict statistically. In fact, in a short number of trials, variability and non-random-looking "streaks" are quite probable." {Wilkepedia}
rd
Please Log in or Create an account to join the conversation.
19 years 9 months ago #9207
by rderosa
Replied by rderosa on topic Reply from Richard DeRosa
<blockquote id="quote"><font size="2" face="Verdana, Arial, Helvetica" id="quote">quote:<hr height="1" noshade id="quote"><i>Originally posted by tvanflandern</i>
<br />Also, believing that a pattern existed and producing a statistical sum did not enable any real "S" images to be found in any single image.<hr height="1" noshade id="quote"></blockquote id="quote"></font id="quote">
I said I would follow-up on this, so I'd like to pass on what I now think about it. This is my interpretation of what I've read so far, and is subject to change, but I suspect this is pretty much what's going on.
If I was to examine the 20,000 trials, looking for an S, disregarding all results from the study, in whatever way anybody thinks they should be examined: individually, summed, or whatever, our conclusion would be that it's gray. The sum would look gray. The individual ones would have some systematic tracings, but nothing too obvious. But some obviously would have higher correlations to "S"s or "S" like fragments, than others.
Now, if we only look at the ones where the subject said "Yes", we would get that S that I posted. If we individually looked at the ones from the "Yes" pile, we would find that they had a higher correlation (on a pixel to pixel basic, I would guess) to the ones from the "No" pile.
<blockquote id="quote"><font size="2" face="Verdana, Arial, Helvetica" id="quote">quote:<hr height="1" noshade id="quote"><i>Originally posted by tvanflandern</i>
<br />
So how can this be applicable to what we are seeing on Mars, which consists of a few cases of single images with impressive and unique details that anyone can see? -|Tom|-<hr height="1" noshade id="quote"></blockquote id="quote"></font id="quote">
I think any individual slide where the subject thinks he sees some correlation with what he's looking for, can be analogous to looking at an individual msss image, and finding some small correlation with what he's looking for.
But the difference is that the study slides are very rudimentary. It's just white noise. The Mars terrain, is much more complex. It contains data that is systematic in more than one spatial frequency. That's not true of white noise.
<b>So, the likelihood of finding faces would seem to be greater in the Mars terrain, than is the likelihood of finding Ss in the white noise in the study. Or at least equally as good.</b>
rd
Please Log in or Create an account to join the conversation.
- tvanflandern
-
- Offline
- Platinum Member
-
Less
More
- Thank you received: 0
19 years 9 months ago #9209
by tvanflandern
Replied by tvanflandern on topic Reply from Tom Van Flandern
<blockquote id="quote"><font size="2" face="Verdana, Arial, Helvetica" id="quote">quote:<hr height="1" noshade id="quote"><i>Originally posted by rderosa</i>
<br />the likelihood of finding faces would seem to be greater in the Mars terrain, than is the likelihood of finding Ss in the white noise in the study. Or at least equally as good.<hr height="1" noshade id="quote"></blockquote id="quote"></font id="quote">But there are no actual Ss in the white noise. No single image passes anyone's threshold of looking like an S. On Mars, many face images have a similar character that they are buried in noise and therefore not evident to most lookers. But some are detailed and apparent to everyone. And that is a very different case from the white noise study.
The Cydonia Face in particular is famous for being the only object of note in a featureless, flat, smooth background for several kilometers in most directions. And the top of the 500-meter-high Face mesa itself is low in noise. The eyebrows, irises, nostrils, and lips features are the only ones on the mesa that could possibly qualify as those features, and yet each had the correct size, shape, location, and orientation to be a deliberate attempt to portray a face. There was no hint of randomness.
And when it was first spotted, no one was looking for faces on Mars. But if Cydonia is one that is not of natural origin, there is likely to be more than one. So I don't think the study of Ss, while interesting, has much relevance here except in cases of very noisy backgrounds, where caution with interpretations is always in order. -|Tom|-
Please Log in or Create an account to join the conversation.
Time to create page: 0.655 seconds